Austin Industrial Market Q2 2025: Vacancy Rises as Pre-Leasing Falls to 0.4%
Austin’s industrial vacancy rate jumps to 17.2% in Q2 2025 as pre-leasing drops to 0.4%. Explore market trends, pricing shifts, and new developments.
July 9, 2025 | by Andres Cisneros-Romo
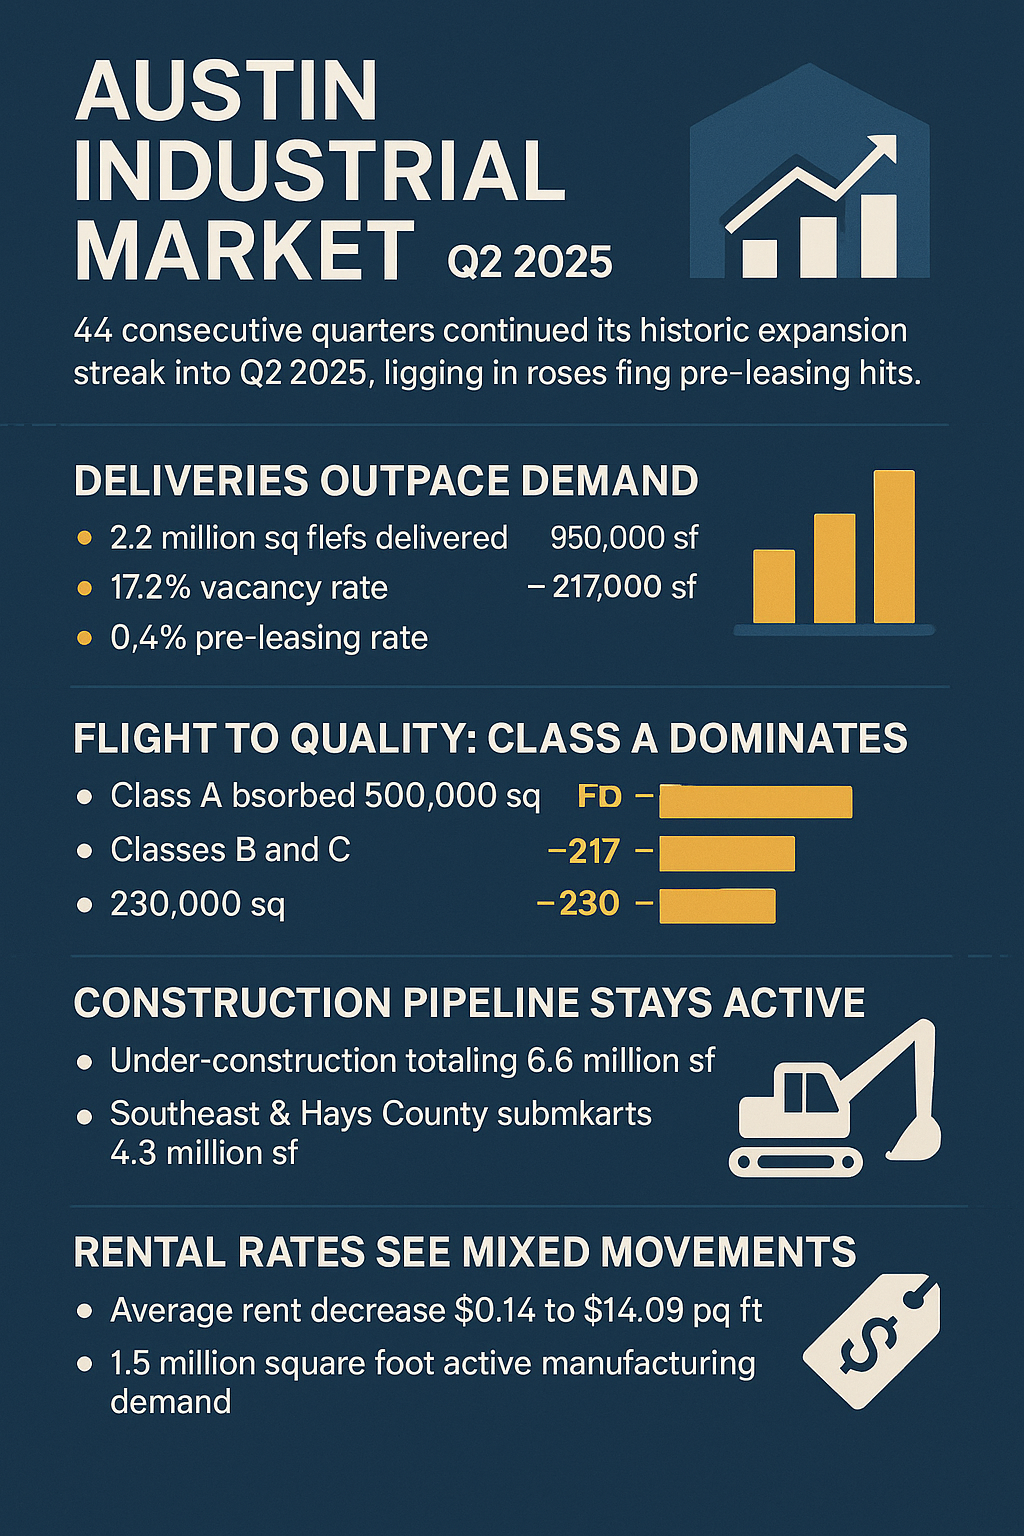
The Austin industrial real estate market continued its historic expansion streak into Q2 2025, logging its 44th consecutive quarter of positive net absorption. However, signs of cooling momentum are beginning to surface as vacancy rates rose sharply and pre-leasing activity hit a low not seen in years.
Deliveries Outpace Demand
Fifteen industrial buildings were delivered across the Austin region in Q2, bringing 2.2 million square feet of new space to market. Yet only 53,000 square feet were absorbed, the lowest quarterly total in over three years, indicating that newly delivered buildings are entering the market largely vacant.
As a result, market-wide vacancy increased to 17.2%, a jump of 180 basis points quarter-over-quarter. The sharp rise in vacancy is exacerbated by an unusually low pre-leasing rate of just 0.4% for properties under construction — a 5.8% drop from the previous quarter.
Flight to Quality: Class A Dominates
Despite the soft absorption overall, Class A industrial space continues to outperform, recording 499,522 square feet of positive absorption this quarter. In contrast, Class B and C properties posted negative absorption, with -216,818 and -229,932 square feet, respectively.
Leasing activity remained strongest in the premium segment, with 11 leases signed totaling 876,170 square feet of Class A space. The largest deal of the quarter involved an EV company leasing 296,960 square feet at the Austin Hills Commerce Center.
Construction Pipeline Stays Active
Developers are showing no signs of slowing down. Q2 saw the start of 17 new industrial projects totaling 1.9 million square feet, nearly replenishing the newly delivered inventory. The total under-construction pipeline stands at 6.6 million square feet.
The Southeast and Hays County submarkets are leading the charge, with 2.6 million and 1.7 million square feet under development, respectively. Notably, all construction starts in Q2 were located south of the Colorado River, signaling a geographic shift in development priorities. Among the new projects, the largest speculative building — 538,720 square feet at Mustang Ridge Business Park — broke ground this quarter.
Rental Rates See Mixed Movements
The average NNN asking rent across all product types declined $0.14 quarter-over-quarter to $14.09 per square foot. This was primarily driven by the return of Class B and C space to the market, which typically commands lower rents.
Still, certain segments saw price growth:
- Manufacturing rents increased $0.27 to $13.87 per square foot
- Flex/R&D space saw a $0.33 increase, now averaging $20.05 per square foot
- Distribution/Logistics rents dipped $0.13, landing at $11.55 per square foot
Small-bay properties under 100,000 square feet also saw pressure, with asking rents dropping $0.19 to $15.19 per square foot.
Year-over-year, asking rents across all product types are up 11.2%, led by the Southeast submarket, where rents have nearly doubled from $8.91 to $16.06 per square foot.
Onshoring Surge Boosts Manufacturing Demand
Demand drivers remain strong, particularly in the manufacturing sector. As tariffs reshape supply chains, the desire for onshore production has surged. CBRE is currently tracking 1.5 million square feet of active manufacturing requirements in the Austin market — nearly four times last year’s levels.
Source: CBRE Research – Austin Industrial Figures Q2 2025
💡 Want more industrial market updates like this?
Subscribe to our weekly digest and get segmented trends across CRE markets nationwide.